Spatial Cost Modelling.
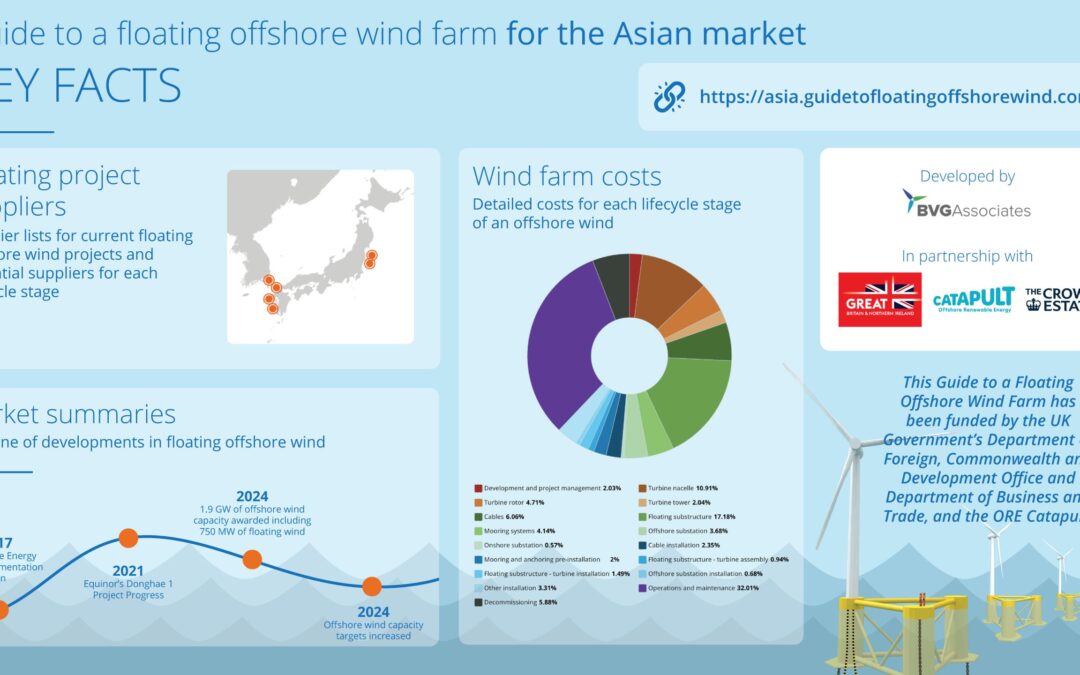
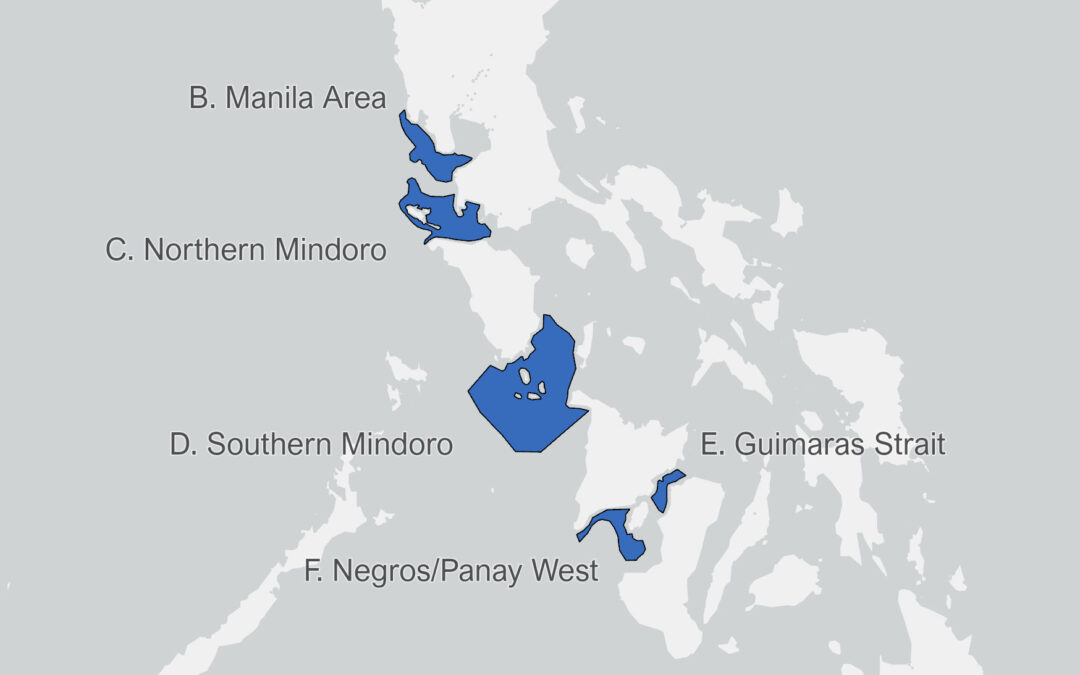
This interactive map provides an indicative levelized cost of energy (LCOE) for offshore wind projects across Europe. It combines spatial GIS data with our in-house LCOE model that provides a detailed cost breakdown from a given set of site and project parameters and future year of installation.
We have developed and validated this model over many years, through many projects for a wide range of clients, globally.
The model uses around 40 different inputs including water depth, wind speed, seabed conditions, turbine rating, rotor diameter, distance to port, distance to grid connection, installation year, commodity prices, and supply chain status and cost base. The LCOE is an aggregation of these costs over time, discounted using a weighted cost of capital (WACC) and divided by energy production.
We can also provide a financial model for any project, accommodating debt structures and using monthly time series resolution to convert cashflow into tax and debt repayment KPIs.
Use the Submit feedback form to get in touch to find out more.
Site finding, spatial planning and merit order analyses
Robust wide-area search and assessment that we can combine with biodiversity, social and technical sensitivity mapping or use to rapidly compare a range of sites and project configurations.
Evidence-based cost modelling – now and in the future
Robust assumptions, industry expertise and validation underpin our LCOE outputs that are used to document the impact of innovations, show future trends in emerging markets and underpin policy decisions about local content.
Financial modelling of projects
Accommodate debt structures and monthly time series resolution to convert cashflow into tax and debt repayment KPIs.
Financial modelling of projects
We combine our cost models with supply chain and occupations analysis to provide workforce forecasts consistent with cost reduction trajectories.
How to use
Please give us your feedback, so we can extend what we provide
On the map, what looks right or wrong?
What else would you like to see? Other regions / other layers / statistical analysis?
Would you like to collaborate in further analysis and dissemination?
How do our LCOE calculations align with what else you have seen?
How would you like to use such data?