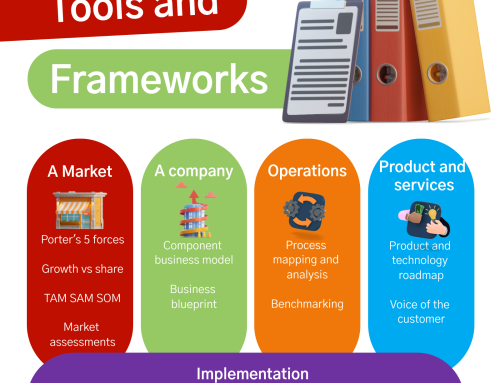
The last blog ended with a little infographic (repeated below) showing how particular tools and frameworks fitted into the market analysis space. In my next blogs I’ll take a quick look at a few of the more common ones we use when supporting customers in their business strategy. We’ll pick on the ones that are likely to have the biggest impact on start-ups and innovators in terms of ease of use and helping you build insight and confidence into your conversations with investors.

TAM SAM SOM
TAM SAM SOM is a market sizing tool, often used by start-ups or investors to assess the potential revenues that can be gained for a specific company or service within a specific market. It (or something similar) is almost always required by investors as part of their due diligence.
- TAM (Total Addressable Market): the total global market demand for a product or service (even if the specific company is not currently active in all locations). Put simply, TAM is everyone you wish to reach.
- SAM (Service Addressable Market): the segment of the market that is addressed by the company’s current product or service and geographical reach. Put simply, SAM is the part of the TAM you will target.
- SOM (Service Obtainable Market): the part of the market that the company can realistically sell to when considering factors such as competition. Put simply, SOM is the part of the SAM you will realistically reach.

A worked example
You provide a software solution in the operational phase of offshore wind projects.
You have determined that the market value for this software is €2,000/turbine/year.
To establish the TAM:
- Create a timeline of operational offshore wind turbines. Build this from historical records showing when and where (geographically) each turbine has been commissioned. Build a forecast showing the same information, based on future projects. These will range from high certainty (projects in construction) to low certainty (projects in early development) to speculative (aligned simply with national ambitions – typically provided in GW, therefore using assumption about turbine sizes to get to turbine numbers).
- Track each turbine as it ages, dropping it out of operation after the end of its lifetime.
- For each year, multiply the number of operational turbines by €2,000 – this is the TAM per year in real terms (that is, ignoring the effect of inflation and future cost changes).
To establish the SAM:
- For each year, remove the parts of the market you will not target. As an example, you may have the following restrictions:
- Due to current reach and growth expectations, you want to focus on EU waters only between 2025 and 2029, then add the USA from 2030.
- For technical reasons, you cannot use this solution on turbines below 6 MW capacity, nor on turbines with floating foundations.
- Hopefully you will have thought of these restrictions when building the pipeline model. If not, you will have to return to the pipeline model to add these dimensions (turbine capacity and foundation type) in.
- For each year, multiply the number of remaining operational turbines by €2,000 – this is the SAM per year in real terms.
To establish the SOM:
- For each year, consider how many of the available turbines from the SOM pipeline you can realistically sell to. Some examples of reasoning might include:
- You are a German supplier with strong relationships with all the German operators. There are strong regulatory requirements for the operators to use a solution similar to the one being considered here. There are currently no feasible alternatives. You decide a realistic target is 50% of the German SAM for 2026 to 2028, falling to 25% as competition increases.
- Your next target market is the UK, where the same regulation does not exist but which you believe there is interest from operators based on adopting good industry practice. You decide that a profile of 10% of UK SAM in 2026 and 20% in 2027 is realistic, falling to a steady 15% thereafter.
- And so on, for each part of the market that you are interested in.
• For each year, multiply the number of remaining operational turbines by €2,000 – this is the SOM per year in real terms.
Things to consider
- When establishing the TAM, you need to carefully consider how you establish the scale of the market in the future. This is an inexact science that require deep industry knowledge. It is often appropriate to get 3rd party specialists in for this. This will provide you with a more thorough analysis of the (and save you the time and risk of learning this in house) and will also provide investors with a greater level of confidence that the analysis is based on solid industry understanding and, crucially, is unbiased.
- As noted in the worked example, a good consultant will also be looking forward to the SAM and SOM parts of the process and asking you all the right questions so that the pipeline model is built with all the required dimensions ready for the SAM and SOM exclusions to be applied without further re-work.
- The exclusions for the SAM will come largely from within your own team. A good external consultant will ask you all the right (and hard) questions, with challenge, to help you apply robust logic and ambition.
- The SOM can be done at a very high level by simply stating rough percentages in terms of market capture. Simply assuming you can capture 15% of the SAM might well be good enough for your early-stage internal market analysis. However, investors will demand considerably greater detail, most notably on your competitors. They will typically want to see a detailed analysis of all your relevant competitors, seeking to understand size, reach, market share, ownership models, trajectories, investment, innovation, and so on. For that level of detail, and for the associated independence required by investors, this level of detail in the SOM will almost always have to be done by an expert 3rd party with deep sector knowledge.
Other market analysis tools and frameworks will be covered in subsequent blogs.


